Statistiques
Freshwater resources
Filter by :
| NoFilter | |||||||||
| Unit : Million m3/year | |||||||||
| Source : Ministry of Agriculture | |||||||||
| Freshwater resources | |||||||||
| 2008 | 2009 | 2010 | 2011 | 2012 | 2013 | 2014 | 2015 | 2016 | |
|---|---|---|---|---|---|---|---|---|---|
| Precipitation | 21120 | 34080 | 21600 | 29280 | 18360 | -- | -- | -- | -- |
| Actual evapotranspiration | 19026 | 30701 | 19458 | 26376 | 16539 | -- | -- | -- | -- |
| Water resources available for annual harvest | 4267 | 4274 | 4267 | 4264 | 4274 | 4274 | 4274 | 4274 | -- |
| Surface water | 2100 | 2100 | 2100 | 2100 | 2100 | 2100 | 2100 | 2100 | 2100 |
| Groundwater | 2167 | 2174 | 2167 | 2164 | 2174 | 2174 | 2174 | 2174 | -- |
jQuery("#tblEmployee-0").table2excel({ exclude: ".excludeThisClass", name: "Worksheet Name", filename: "SomeFile" });
Source : Ministry of AgricultureUpdate : 25-03-2021
Water balance
Filter by :
| NoFilter | ||||||||
| Unit : Million m3/year | ||||||||
| Source : Ministry of Agriculture | ||||||||
| Water balance | ||||||||
| 2005 | 2006 | 2007 | 2008 | 2009 | 2010 | 2011 | 2012 | |
|---|---|---|---|---|---|---|---|---|
| The total volume of fresh water withdrawn | 2448.3 | 2506.6 | 2540.7 | 2555.3 | 2562.2 | 2721.0 | -- | -- |
| Waters returned to the environment without use | 61.0 | 64.0 | 63.5 | 42.2 | 39.0 | 52.0 | -- | -- |
| Net volume of fresh water withdrawal | 2387.3 | 2442.6 | 2477.2 | 2513.1 | 2523.2 | 2669.0 | -- | -- |
| Desalinated water | 15.4 | 16.5 | 18.2 | 18.2 | 19.5 | 19.7 | 19.3 | 19.7 |
| Reused water | 67.0 | 67.0 | 67.0 | 67.0 | 67.0 | 67.0 | 67.0 | -- |
| Total volume of freshwater made usable | 2469.7 | 2526.1 | 2562.4 | 2598.3 | 2609.7 | 2755.7 | -- | -- |
| Losses resulting from leakage occurred during transport | 439.0 | 436.0 | 441.0 | 447.0 | 445.0 | 449.0 | -- | -- |
| Wastewater production | 272.1 | 280.7 | 286.1 | 298.1 | 304.8 | 317.4 | -- | -- |
| Evapotranspiration | 1758.7 | 1809.4 | 1835.3 | 1853.2 | 1859.9 | 1989.3 | -- | -- |
jQuery("#tblEmployee-0").table2excel({ exclude: ".excludeThisClass", name: "Worksheet Name", filename: "SomeFile" });
Source : Ministry of AgricultureUpdate : 25-03-2021
Recurring water
Filter by :
| NoFilter | |||||||||
| Unit : Million m3/year | |||||||||
| Source : Ministry of Agriculture | |||||||||
| Recurring water | |||||||||
| 2002 | 2003 | 2004 | 2005 | 2006 | 2007 | 2008 | 2009 | 2010 | |
|---|---|---|---|---|---|---|---|---|---|
| Net volume of fresh surface water withdrawn | 2447.6 | 2385.9 | 2350.9 | 2448.3 | 2506.6 | 2540.7 | 2555.3 | 2562.2 | 2721.0 |
| Volume of water taken by water supply services | 1384.6 | 1331.9 | 1316.9 | 1381.3 | 1432.3 | 1486.5 | 1488.0 | 1492.0 | 1584.0 |
| Volume of water taken directly by agent or economic activity | 1063.0 | 1054.0 | 1034.0 | 1067.0 | 1074.3 | 1054.2 | 1067.3 | 1070.2 | 1137.0 |
| Net volume of fresh groundwater collected | 1913.0 | 1887.0 | 1905.0 | 1950.0 | 1978.0 | 1995.0 | 2034.0 | 2050.0 | 2175.0 |
jQuery("#tblEmployee-0").table2excel({ exclude: ".excludeThisClass", name: "Worksheet Name", filename: "SomeFile" });
Source : Ministry of AgricultureUpdate : 25-03-2021
Public procurement
Filter by :
| NoFilter | |||||||||
| Unit : Million m3/year | |||||||||
| Source : Ministry of Agriculture | |||||||||
| Public procurement | |||||||||
| 2004 | 2005 | 2006 | 2007 | 2008 | 2009 | 2010 | 2011 | 2012 | |
|---|---|---|---|---|---|---|---|---|---|
| Net volume of fresh water supplied by the water services (ISIC rev4 36) | 1316.9 | 1381.3 | 1432.3 | 1486.5 | 1488.0 | 1492.0 | -- | -- | -- |
| Total freshwater losses during transport | 89.2 | 94.4 | 102.0 | 108.2 | 117.6 | 124.8 | 136.4 | 150.8 | 161.7 |
| Net volume of fresh water supplied by the water services | 923.9 | 942.3 | 996.3 | 1044.5 | 1041.0 | 1047.0 | -- | -- | -- |
| Percentage of population served by public water supply services | 79.8 | 80.6 | 81.0 | 81.4 | 81.9 | 82.3 | 82.6 | 82.7 | -- |
jQuery("#tblEmployee-0").table2excel({ exclude: ".excludeThisClass", name: "Worksheet Name", filename: "SomeFile" });
Source : Ministry of AgricultureUpdate : 25-03-2021
Total water use
Filter by :
| NoFilter | |||||||||
| Unit : Million m3/year | |||||||||
| Source : Ministry of Agriculture | |||||||||
| Total water use | |||||||||
| 2007 | 2008 | 2009 | 2010 | 2011 | 2012 | 2013 | 2014 | 2015 | |
|---|---|---|---|---|---|---|---|---|---|
| Households | 251.9 | 266.4 | 272.5 | 289.6 | 299.5 | -- | -- | -- | -- |
| Households connected to water network | 244.8 | 257.9 | 264.3 | 279.1 | 289.0 | 309.9 | 307.7 | 321.1 | 333.0 |
| Families not connected to water network | 7.1 | 8.5 | 8.2 | 10.5 | 10.5 | 11.8 | 12.4 | 11.8 | 13.1 |
| Agriculture, forestry and fishing | 1691.8 | 1685.6 | 1686.6 | -- | -- | -- | -- | -- | -- |
| Industry | 88.2 | 88.0 | 89.6 | 32.9 | 29.0 | 31.8 | 32.4 | 31.9 | 28.2 |
| Other economic agents | 2.0 | 2.4 | 2.3 | 2.7 | 2.4 | 2.3 | 2.3 | 2.1 | 2.3 |
| Mass consumption | 42.5 | 42.6 | 43.7 | 44.5 | 45.3 | 45.7 | 45.2 | 45.5 | 45.9 |
| Tourism | 18.4 | 18.3 | 17.5 | 17.9 | 13.5 | 16.0 | 16.1 | 15.5 | 12.3 |
jQuery("#tblEmployee-0").table2excel({ exclude: ".excludeThisClass", name: "Worksheet Name", filename: "SomeFile" });
Source : Ministry of AgricultureUpdate : 25-03-2021
| 2025-04-18 | Report
This is a reference work for those who need information about the economic and social life of the country.
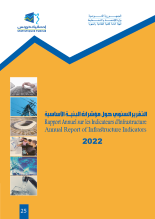
| 2024-05-16 | Report
Ce rapport annuel sur les indicateurs d'infrastructure permet de mettre en relief les efforts consentis par l'Etat dans les différents domaines et secteurs et en premier lieu le secteur des infrastructures.
| 2023-11-17 | Report
This is a reference work for those who need information about the economic and social life of the country.
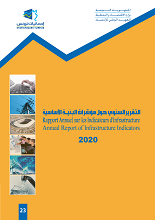
| 2023-02-02 | Report
This report of infrastructure indicators includes maps and data to facilitate analysis and show off the efforts made by the state in different sectors and fields, in particular infrastructure sector.
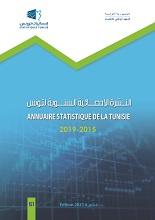
| 2022-10-05 | Report
This is a reference work for those who need information about the economic and social life of the country.

| 2022-01-21 | Report
This report of infrastructure indicators includes maps and data to facilitate analysis and show off the efforts made by the state in different sectors and fields, in particular infrastructure sector.

| 2021-07-07 | Report
This is a reference work for those who need information about the economic and social life of the country.

| 2021-02-19 | Report
This report of infrastructure indicators includes maps and data to facilitate analysis and show off the efforts made by the state in different sectors and fields, in particular infrastructure sector.

| 2020-09-18 | Report
This is a reference work for those who need information about the economic and social life of the country.
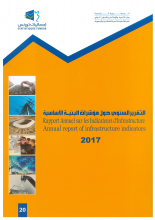
| 2020-03-06 | Report
This report of infrastructure indicators includes maps and data to facilitate analysis and show off the efforts made by the state in different sectors and fields, in particular infrastructure sector.
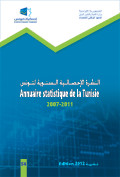
| 2019-07-29 | Report
This is a reference work for those who need information about the economic and social life of the country.
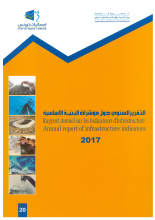
| 2019-06-17 | Report
This report of infrastructure indicators includes maps and data to facilitate analysis and show off the efforts made by the state in different sectors and fields, in particular infrastructure sector.
| 2018-05-24 | Report
This is a reference work for those who need information about the economic and social life of the country.

| 2018-05-10 | Report
This report of infrastructure indicators includes maps and data to facilitate analysis and show off the efforts made by the state in different sectors and fields, in particular infrastructure sector.
| 2017-05-12 | Report
This is a reference work for those who need information about the economic and social life of the country.

| 2017-02-15 | Report
This report of infrastructure indicators includes maps and data to facilitate analysis and show off the efforts made by the state in different sectors and fields, in particular infrastructure sector.
| 2016-03-28 | Report
This is a reference work for those who need information about the economic and social life of the country.

| 2014-07-10 | Report
This report of infrastructure indicators includes maps and data to facilitate analysis and show off the efforts made by the state in different sectors and fields, in particular infrastructure sector.
| 2013-10-24 | Report
This is a reference work for those who need information about the economic and social life of the country.
| 2012-08-11 | Report
This is a reference work for those who need information about the economic and social life of the country.

| 2011-11-12 | Report
This is a reference work for those who need information about the economic and social life of the country.

| 2010-03-26 | Report
This is a reference work for those who need information about the economic and social life of the country.

| 2009-06-13 | Report
This is a reference work for those who need information about the economic and social life of the country.

| 2008-09-21 | Report
This is a reference work for those who need information about the economic and social life of the country.

| 2007-08-15 | Report
This is a reference work for those who need information about the economic and social life of the country.

| 2006-05-16 | Report
This is a reference work for those who need information about the economic and social life of the country.

| 2005-09-22 | Report
This is a reference work for those who need information about the economic and social life of the country.

| 2004-10-15 | Report
This is a reference work for those who need information about the economic and social life of the country.

| 2003-07-15 | Report
This is a reference work for those who need information about the economic and social life of the country.

| 2002-09-14 | Report
This is a reference work for those who need information about the economic and social life of the country.
«
»
No content

