Statistiques
The prices of the year 2015 in million dinars
Filter by :
| NoFilter | ||||||||
| Unit : | ||||||||
| Source : | ||||||||
| The prices of the year 2015 in million dinars | ||||||||
| fourth-quarter 2023 | first-quarter 2024 | second-quarter 2024 | third-quarter 2024 | fourth-quarter 2024 | first-quarter 2025 | second-quarter 2025 | third-quarter 2025 | |
|---|---|---|---|---|---|---|---|---|
| Agriculture, forestry and fishing | 1890.1 | 2036.2 | 2052.4 | 2060.4 | 2128.7 | 2184.6 | 2254.3 | 2296.9 |
| Oil and natural gas extraction | 514.4 | 414.3 | 428.2 | 425.8 | 426.9 | 384.4 | 380.5 | 370.2 |
| Extraction of mining products | 142.5 | 147.2 | 148.1 | 157.1 | 183.7 | 173.1 | 206.6 | 206.9 |
| Agrifoods industries | 800.8 | 831.1 | 817.2 | 824.9 | 819.3 | 890.2 | 822.8 | 833.3 |
| Textile, clothing and leather industry | 579.7 | 580.3 | 557.0 | 586.4 | 562.0 | 571.5 | 553.0 | 564.4 |
| Oil refinery | 11.3 | 11.3 | 19.0 | 20.2 | -1.4 | 1.0 | 7.2 | 19.8 |
| Chemical industries | 256.3 | 261.4 | 240.5 | 270.0 | 264.6 | 251.2 | 269.0 | 276.5 |
| Building materials industry, ceramics and glass | 204.2 | 208.7 | 203.1 | 218.1 | 204.9 | 207.3 | 219.4 | 221.2 |
| Mechanical and electrical industries | 996.4 | 958.1 | 969.5 | 1004.7 | 1025.2 | 968.3 | 1063.1 | 1053.9 |
| Various industries | 403.6 | 386.0 | 384.0 | 401.8 | 401.0 | 385.3 | 389.4 | 409.7 |
| Production and distribution of electricity and gas | 264.6 | 247.2 | 269.8 | 280.5 | 238.9 | 247.1 | 279.0 | 296.7 |
| Water distribution and treatment of wastewater and waste | 189.8 | 183.5 | 186.3 | 182.1 | 187.8 | 189.0 | 190.5 | 190.6 |
| Construction | 1000.2 | 1013.2 | 991.3 | 994.7 | 1018.8 | 1043.1 | 1080.0 | 1034.0 |
| Trade, maintenance and repair | 2805.0 | 2795.4 | 2797.5 | 2834.2 | 2878.6 | 2849.3 | 2875.3 | 2877.4 |
| Transportation and warehousing services | 1336.2 | 1393.9 | 1422.7 | 1428.7 | 1405.2 | 1384.8 | 1464.9 | 1432.5 |
| Hotel, cafe and restaurant services | 762.7 | 761.2 | 770.8 | 773.7 | 782.7 | 804.5 | 825.1 | 828.5 |
| Information and communication | 884.5 | 885.6 | 892.7 | 888.2 | 894.9 | 886.1 | 906.6 | 912.5 |
| Financial activities | 1025.6 | 1042.6 | 1049.9 | 1004.6 | 1002.6 | 953.0 | 978.2 | 894.3 |
| Public administration and defense services | 2189.5 | 2211.1 | 2216.0 | 2200.7 | 2237.5 | 2247.2 | 2250.1 | 2267.8 |
| Private and public education | 1570.6 | 1579.4 | 1584.6 | 1590.9 | 1608.5 | 1611.3 | 1616.6 | 1624.3 |
| Private and public health and social action | 1059.4 | 1056.7 | 1054.2 | 1063.2 | 1075.0 | 1083.5 | 1091.8 | 1092.5 |
| Other market services | 1448.5 | 1458.5 | 1465.8 | 1473.1 | 1476.9 | 1490.6 | 1507.0 | 1510.7 |
| Other household activities | 1597.4 | 1611.3 | 1614.8 | 1634.1 | 1634.1 | 1638.1 | 1641.7 | 1658.6 |
| Services provided by associative organizations | 65.5 | 64.8 | 65.7 | 65.9 | 65.9 | 66.2 | 67.2 | 67.3 |
| Taxes net of subsidies on products | 1769.9 | 1787.5 | 1807.6 | 1807.5 | 1832.5 | 1808.6 | 1833.3 | 1827.1 |
| Gross domestic product | 23768.4 | 23926.6 | 24008.8 | 24191.6 | 24355.0 | 24319.1 | 24772.2 | 24767.6 |
jQuery("#tblEmployee-0").table2excel({ exclude: ".excludeThisClass", name: "Worksheet Name", filename: "SomeFile" });
Source : National Institute of StatisticsUpdate : 15-11-2025
Annual Slip (Q / Q-4) by the prices of the year 2015
Filter by :
| NoFilter | ||||||||
| Unit : | ||||||||
| Source : | ||||||||
| Annual Slip (Q / Q-4) by the prices of the year 2015 | ||||||||
| fourth-quarter 2023 | first-quarter 2024 | second-quarter 2024 | third-quarter 2024 | fourth-quarter 2024 | first-quarter 2025 | second-quarter 2025 | third-quarter 2025 | |
|---|---|---|---|---|---|---|---|---|
| Agriculture, forestry and fishing | -16.5 | 2.8 | 9.3 | 11.5 | 12.6 | 7.3 | 9.8 | 11.5 |
| Oil and natural gas extraction | -1.4 | -18.6 | -22.2 | -19.7 | -17.0 | -7.2 | -11.1 | -13.1 |
| Extraction of mining products | -8.0 | -5.0 | 1.8 | 15.0 | 28.9 | 17.6 | 39.5 | 31.7 |
| Agrifoods industries | -0.3 | 0.9 | 3.0 | 4.2 | 2.3 | 7.1 | 0.7 | 1.0 |
| Textile, clothing and leather industry | -9.5 | -9.6 | -8.7 | -0.3 | -3.0 | -1.5 | -0.7 | -3.8 |
| Oil refinery | -57.5 | -45.5 | 275.9 | 186.3 | -112.0 | -91.4 | -62.3 | -2.3 |
| Chemical industries | -5.9 | -2.4 | -11.9 | 4.3 | 3.2 | -3.9 | 11.9 | 2.4 |
| Building materials industry, ceramics and glass | -5.8 | -5.6 | -6.8 | -3.8 | 0.4 | -0.7 | 8.0 | 1.4 |
| Mechanical and electrical industries | 2.4 | -1.1 | 0.1 | 4.0 | 2.9 | 1.1 | 9.7 | 4.9 |
| Various industries | 3.2 | -1.1 | -3.1 | -2.5 | -0.6 | -0.2 | 1.4 | 2.0 |
| Production and distribution of electricity and gas | 6.6 | -1.1 | 17.1 | 0.8 | -9.7 | -0.1 | 3.4 | 5.8 |
| Water distribution and treatment of wastewater and waste | 3.7 | -2.7 | -2.0 | -4.1 | -1.1 | 3.0 | 2.3 | 4.7 |
| Construction | -0.6 | -5.1 | -0.3 | -0.6 | 1.9 | 2.9 | 9.0 | 3.9 |
| Trade, maintenance and repair | 0.5 | 0.1 | 0.4 | 1.5 | 2.6 | 1.9 | 2.8 | 1.5 |
| Transportation and warehousing services | -0.9 | 1.9 | 2.0 | 1.8 | 5.2 | -0.7 | 3.0 | 0.3 |
| Hotel, cafe and restaurant services | 5.5 | 4.5 | 5.1 | 3.4 | 2.6 | 5.7 | 7.0 | 7.1 |
| Information and communication | 3.3 | 1.7 | 2.0 | 1.2 | 1.2 | 0.1 | 1.5 | 2.7 |
| Financial activities | 5.9 | 5.7 | 3.2 | 4.1 | -2.2 | -8.6 | -6.8 | -11.0 |
| Public administration and defense services | 0.8 | 1.9 | 1.5 | 0.7 | 2.2 | 1.6 | 1.5 | 3.1 |
| Private and public education | 1.1 | 1.8 | 1.5 | 1.5 | 2.4 | 2.0 | 2.0 | 2.1 |
| Private and public health and social action | 5.4 | 3.8 | 1.8 | 0.7 | 1.5 | 2.5 | 3.6 | 2.8 |
| Other market services | 3.9 | 3.1 | 3.0 | 2.6 | 2.0 | 2.2 | 2.8 | 2.5 |
| Other household activities | 1.3 | 1.9 | 2.1 | 2.7 | 2.3 | 1.7 | 1.7 | 1.5 |
| Services provided by associative organizations | 8.1 | 2.6 | 1.0 | 0.9 | 0.6 | 2.1 | 2.2 | 2.0 |
| Taxes net of subsidies on products | 4.4 | 0.7 | 2.2 | 1.9 | 3.5 | 1.2 | 1.4 | 1.1 |
| Gross domestic product | -0.3 | 0.5 | 1.4 | 2.1 | 2.5 | 1.6 | 3.2 | 2.4 |
jQuery("#tblEmployee-0").table2excel({ exclude: ".excludeThisClass", name: "Worksheet Name", filename: "SomeFile" });
Source : National Institute of StatisticsUpdate : 15-11-2025
Quarterly variations (Q / Q-1) by the 2015 year price
Filter by :
| NoFilter | ||||||||
| Unit : | ||||||||
| Source : | ||||||||
| Quarterly variations (Q / Q-1) by the 2015 year price | ||||||||
| fourth-quarter 2023 | first-quarter 2024 | second-quarter 2024 | third-quarter 2024 | fourth-quarter 2024 | first-quarter 2025 | second-quarter 2025 | third-quarter 2025 | |
|---|---|---|---|---|---|---|---|---|
| Agriculture, forestry and fishing | 2.3 | 7.7 | 0.8 | 0.4 | 3.3 | 2.6 | 3.2 | 1.9 |
| Oil and natural gas extraction | -3.1 | -19.5 | 3.4 | -0.5 | 0.3 | -10.0 | -1.0 | -2.7 |
| Extraction of mining products | 4.3 | 3.3 | 0.6 | 6.1 | 16.9 | -5.8 | 19.4 | 0.1 |
| Agrifoods industries | 1.2 | 3.8 | -1.7 | 0.9 | -0.7 | 8.7 | -7.6 | 1.3 |
| Textile, clothing and leather industry | -1.5 | 0.1 | -4.0 | 5.3 | -4.2 | 1.7 | -3.2 | 2.1 |
| Oil refinery | 59.3 | 0.4 | 67.9 | 6.6 | -106.7 | -172.0 | 635.2 | 176.1 |
| Chemical industries | -1.0 | 2.0 | -8.0 | 12.3 | -2.0 | -5.0 | 7.1 | 2.8 |
| Building materials industry, ceramics and glass | -9.9 | 2.2 | -2.7 | 7.4 | -6.0 | 1.2 | 5.8 | 0.8 |
| Mechanical and electrical industries | 3.2 | -3.8 | 1.2 | 3.6 | 2.0 | -5.6 | 9.8 | -0.9 |
| Various industries | -2.0 | -4.3 | -0.5 | 4.6 | -0.2 | -3.9 | 1.1 | 5.2 |
| Production and distribution of electricity and gas | -4.9 | -6.6 | 9.1 | 3.9 | -14.8 | 3.4 | 12.9 | 6.3 |
| Water distribution and treatment of wastewater and waste | -0.1 | -3.3 | 1.5 | -2.3 | 3.1 | 0.6 | 0.8 | 0.0 |
| Construction | -0.1 | 1.3 | -2.2 | 0.3 | 2.4 | 2.4 | 3.5 | -4.3 |
| Trade, maintenance and repair | 0.4 | -0.3 | 0.1 | 1.3 | 1.6 | -1.0 | 0.9 | 0.1 |
| Transportation and warehousing services | -4.8 | 4.3 | 2.1 | 0.4 | -1.6 | -1.5 | 5.8 | -2.2 |
| Hotel, cafe and restaurant services | 1.9 | -0.2 | 1.3 | 0.4 | 1.2 | 2.8 | 2.6 | 0.4 |
| Information and communication | 0.7 | 0.1 | 0.8 | -0.5 | 0.8 | -1.0 | 2.3 | 0.7 |
| Financial activities | 6.3 | 1.6 | 0.7 | -4.3 | -0.2 | -5.0 | 2.7 | -8.6 |
| Public administration and defense services | 0.2 | 1.0 | 0.2 | -0.7 | 1.7 | 0.4 | 0.1 | 0.8 |
| Private and public education | 0.2 | 0.6 | 0.3 | 0.4 | 1.1 | 0.2 | 0.3 | 0.5 |
| Private and public health and social action | 0.3 | -0.2 | -0.2 | 0.8 | 1.1 | 0.8 | 0.8 | 0.1 |
| Other market services | 0.9 | 0.7 | 0.5 | 0.5 | 0.3 | 0.9 | 1.1 | 0.2 |
| Other household activities | 0.4 | 0.9 | 0.2 | 1.2 | 0.0 | 0.2 | 0.2 | 1.0 |
| Services provided by associative organizations | 0.3 | -1.0 | 1.4 | 0.3 | 0.0 | 0.5 | 1.4 | 0.1 |
| Taxes net of subsidies on products | -0.2 | 1.0 | 1.1 | 0.0 | 1.4 | -1.3 | 1.4 | -0.3 |
| Gross domestic product | 0.3 | 0.7 | 0.3 | 0.8 | 0.7 | -0.1 | 1.9 | 0.0 |
jQuery("#tblEmployee-0").table2excel({ exclude: ".excludeThisClass", name: "Worksheet Name", filename: "SomeFile" });
Source : National Institute of StatisticsUpdate : 15-11-2025
At current prices in million dinars
Filter by :
| NoFilter | ||||||||
| Unit : | ||||||||
| Source : | ||||||||
| At current prices in million dinars | ||||||||
| fourth-quarter 2023 | first-quarter 2024 | second-quarter 2024 | third-quarter 2024 | fourth-quarter 2024 | first-quarter 2025 | second-quarter 2025 | third-quarter 2025 | |
|---|---|---|---|---|---|---|---|---|
| Agriculture, forestry and fishing | 3641.9 | 3727.4 | 3862.1 | 3875.5 | 4093.6 | 4112.9 | 4313.8 | 4367.3 |
| Oil and natural gas extraction | 1209.6 | 927.9 | 981.3 | 1014.6 | 930.4 | 853.0 | 805.9 | 774.9 |
| Extraction of mining products | 179.5 | 171.1 | 195.1 | 222.7 | 245.2 | 220.9 | 286.9 | 307.8 |
| Agrifoods industries | 1236.8 | 1270.7 | 1317.0 | 1293.5 | 1259.8 | 1279.5 | 1240.7 | 1241.9 |
| Textile, clothing and leather industry | 1025.1 | 1026.1 | 1012.4 | 1015.6 | 1002.9 | 1006.8 | 1049.3 | 987.0 |
| Oil refinery | 90.9 | 63.3 | 61.3 | 77.1 | 54.8 | 5.5 | 23.1 | 75.3 |
| Chemical industries | 438.6 | 460.4 | 417.8 | 454.3 | 465.5 | 474.3 | 513.7 | 537.3 |
| Building materials industry, ceramics and glass | 323.0 | 341.1 | 335.7 | 352.4 | 340.5 | 348.9 | 374.9 | 370.2 |
| Mechanical and electrical industries | 1957.8 | 1997.0 | 1982.4 | 2134.4 | 2167.2 | 2062.6 | 2281.1 | 2339.0 |
| Various industries | 692.6 | 663.8 | 664.1 | 694.0 | 711.3 | 682.4 | 688.0 | 719.9 |
| Production and distribution of electricity and gas | 404.0 | 354.3 | 377.9 | 392.3 | 358.8 | 353.4 | 387.7 | 407.8 |
| Water distribution and treatment of wastewater and waste | 246.0 | 252.6 | 267.7 | 254.9 | 264.7 | 266.8 | 273.8 | 266.8 |
| Construction | 1259.5 | 1284.9 | 1279.0 | 1292.2 | 1333.5 | 1362.5 | 1440.8 | 1391.1 |
| Trade, maintenance and repair | 4760.5 | 5112.9 | 5048.5 | 5243.9 | 5273.7 | 5513.3 | 5472.0 | 5599.5 |
| Transportation and warehousing services | 1747.4 | 1898.6 | 1939.7 | 1941.6 | 1910.3 | 1947.0 | 2064.5 | 2013.9 |
| Hotel, cafe and restaurant services | 1549.3 | 1592.8 | 1725.9 | 1718.3 | 1754.7 | 1876.7 | 2050.2 | 2034.1 |
| Information and communication | 1132.9 | 1160.8 | 1153.1 | 1150.7 | 1204.4 | 1211.8 | 1218.6 | 1216.6 |
| Financial activities | 1628.3 | 1592.3 | 1645.0 | 1662.7 | 1664.8 | 1483.1 | 1557.3 | 1502.4 |
| Public administration and defense services | 4177.5 | 4088.0 | 4192.7 | 4167.8 | 4280.0 | 4212.5 | 4331.7 | 4516.1 |
| Private and public education | 2413.9 | 2412.4 | 2420.9 | 2444.5 | 2492.3 | 2535.6 | 2545.2 | 2626.1 |
| Private and public health and social action | 1669.5 | 1726.2 | 1735.1 | 1721.4 | 1786.0 | 1829.4 | 1836.5 | 1847.4 |
| Other market services | 2272.1 | 2474.4 | 2487.3 | 2532.0 | 2536.3 | 2665.8 | 2701.5 | 2743.7 |
| Other household activities | 2289.7 | 2340.5 | 2443.1 | 2464.0 | 2465.3 | 2504.4 | 2617.2 | 2637.6 |
| Services provided by associative organizations | 96.8 | 101.7 | 105.1 | 105.0 | 105.2 | 108.0 | 112.0 | 112.3 |
| Market activities | 29282.8 | 29990.5 | 30439.7 | 31061.2 | 31388.8 | 31627.8 | 32724.3 | 32884.9 |
| Nonmarket activities | 7160.4 | 7050.6 | 7210.6 | 7164.3 | 7312.3 | 7289.3 | 7462.4 | 7751.2 |
| Total added value | 36443.2 | 37041.1 | 37650.3 | 38225.4 | 38701.1 | 38917.0 | 40186.6 | 40636.1 |
| Taxes net of subsidies on products | 1695.4 | 2107.7 | 1959.5 | 1993.7 | 2081.8 | 2406.6 | 2211.0 | 2238.5 |
| Gross domestic product | 38138.5 | 39148.8 | 39609.7 | 40219.1 | 40782.9 | 41323.7 | 42397.6 | 42874.7 |
jQuery("#tblEmployee-0").table2excel({ exclude: ".excludeThisClass", name: "Worksheet Name", filename: "SomeFile" });
Source : National Institute of StatisticsUpdate : 06-12-2025
Annual Slip (Q / Q-4) at current prices
Filter by :
| NoFilter | ||||||||
| Unit : | ||||||||
| Source : | ||||||||
| Annual Slip (Q / Q-4) at current prices | ||||||||
| fourth-quarter 2023 | first-quarter 2024 | second-quarter 2024 | third-quarter 2024 | fourth-quarter 2024 | first-quarter 2025 | second-quarter 2025 | third-quarter 2025 | |
|---|---|---|---|---|---|---|---|---|
| Agriculture, forestry and fishing | -5.5 | 4.5 | 9.8 | 12.1 | 12.4 | 10.3 | 11.7 | 12.7 |
| Oil and natural gas extraction | -8.9 | -18.6 | -20.0 | -19.0 | -23.1 | -8.1 | -17.9 | -23.6 |
| Extraction of mining products | -38.9 | -24.6 | -20.1 | 18.8 | 36.6 | 29.1 | 47.1 | 38.3 |
| Agrifoods industries | 6.2 | 5.6 | 11.5 | 5.3 | 1.9 | 0.7 | -5.8 | -4.0 |
| Textile, clothing and leather industry | -5.1 | -6.7 | -6.3 | 0.6 | -2.2 | -1.9 | 3.6 | -2.8 |
| Oil refinery | -27.9 | 181.1 | 132.7 | 77.6 | -39.8 | -91.4 | -62.3 | -2.3 |
| Chemical industries | -18.6 | -8.2 | -7.8 | 4.6 | 6.1 | 3.0 | 23.0 | 18.3 |
| Building materials industry, ceramics and glass | -6.9 | -8.3 | -6.7 | -1.4 | 5.4 | 2.3 | 11.7 | 5.0 |
| Mechanical and electrical industries | 11.6 | 9.2 | 9.4 | 13.1 | 10.7 | 3.3 | 15.1 | 9.6 |
| Various industries | 2.1 | -2.9 | -3.0 | 1.0 | 2.7 | 2.8 | 3.6 | 3.7 |
| Production and distribution of electricity and gas | -1.9 | -9.1 | 6.5 | -5.4 | -11.2 | -0.3 | 2.6 | 3.9 |
| Water distribution and treatment of wastewater and waste | 10.6 | 1.2 | 6.8 | 5.1 | 7.6 | 5.6 | 2.3 | 4.7 |
| Construction | -1.6 | -2.9 | -0.7 | 1.9 | 5.9 | 6.0 | 12.7 | 7.7 |
| Trade, maintenance and repair | 8.6 | 7.2 | 11.3 | 9.6 | 10.8 | 7.8 | 8.4 | 6.8 |
| Transportation and warehousing services | 5.0 | 5.2 | 5.2 | 5.3 | 9.3 | 2.5 | 6.4 | 3.7 |
| Hotel, cafe and restaurant services | 21.3 | 13.3 | 14.6 | 11.5 | 13.3 | 17.8 | 18.8 | 18.4 |
| Information and communication | 8.5 | 5.3 | 5.9 | 5.9 | 6.3 | 4.4 | 5.7 | 5.7 |
| Financial activities | 10.6 | 9.3 | 6.5 | 7.2 | 2.2 | -6.9 | -5.3 | -9.6 |
| Public administration and defense services | 1.7 | 3.3 | 5.7 | 3.8 | 2.5 | 3.0 | 3.3 | 8.4 |
| Private and public education | 3.5 | 6.1 | 5.4 | 3.7 | 3.2 | 5.1 | 5.1 | 7.4 |
| Private and public health and social action | 12.5 | 8.4 | 8.4 | 7.2 | 7.0 | 6.0 | 5.8 | 7.3 |
| Other market services | 15.5 | 13.0 | 12.5 | 11.6 | 11.6 | 7.7 | 8.6 | 8.4 |
| Other household activities | 7.1 | 7.2 | 7.2 | 7.8 | 7.7 | 7.0 | 7.1 | 7.0 |
| Services provided by associative organizations | 13.0 | 8.1 | 8.5 | 8.1 | 8.7 | 6.3 | 6.6 | 6.9 |
| Market activities | 4.5 | 4.8 | 6.6 | 7.3 | 7.2 | 5.5 | 7.5 | 5.9 |
| Nonmarket activities | 2.1 | 3.4 | 4.8 | 3.0 | 2.1 | 3.4 | 3.5 | 8.2 |
| Total added value | 4.0 | 4.5 | 6.2 | 6.5 | 6.2 | 5.1 | 6.7 | 6.3 |
| Taxes net of subsidies on products | 123.2 | 42.0 | 18.3 | 20.0 | 22.8 | 14.2 | 12.8 | 12.3 |
| Gross domestic product | 6.6 | 6.0 | 6.7 | 7.1 | 6.9 | 5.6 | 7.0 | 6.6 |
jQuery("#tblEmployee-0").table2excel({ exclude: ".excludeThisClass", name: "Worksheet Name", filename: "SomeFile" });
Source : National Institute of StatisticsUpdate : 06-12-2025
Quarterly variations (Q / Q-1) by current prices
Filter by :
| NoFilter | ||||||||
| Unit : | ||||||||
| Source : | ||||||||
| Quarterly variations (Q / Q-1) by current prices | ||||||||
| fourth-quarter 2023 | first-quarter 2024 | second-quarter 2024 | third-quarter 2024 | fourth-quarter 2024 | first-quarter 2025 | second-quarter 2025 | third-quarter 2025 | |
|---|---|---|---|---|---|---|---|---|
| Agriculture, forestry and fishing | 5.3 | 2.3 | 3.6 | 0.3 | 5.6 | 0.5 | 4.9 | 1.2 |
| Oil and natural gas extraction | -3.4 | -23.3 | 5.7 | 3.4 | -8.3 | -8.3 | -5.5 | -3.8 |
| Extraction of mining products | -4.2 | -4.7 | 14.0 | 14.1 | 10.1 | -9.9 | 29.9 | 7.3 |
| Agrifoods industries | 0.7 | 2.7 | 3.6 | -1.8 | -2.6 | 1.6 | -3.0 | 0.1 |
| Textile, clothing and leather industry | 1.5 | 0.1 | -1.3 | 0.3 | -1.2 | 0.4 | 4.2 | -5.9 |
| Oil refinery | 109.5 | -30.3 | -3.2 | 25.7 | -28.9 | -90.0 | 323.8 | 225.7 |
| Chemical industries | 1.0 | 5.0 | -9.2 | 8.7 | 2.5 | 1.9 | 8.3 | 4.6 |
| Building materials industry, ceramics and glass | -9.6 | 5.6 | -1.6 | 5.0 | -3.4 | 2.5 | 7.5 | -1.3 |
| Mechanical and electrical industries | 3.7 | 2.0 | -0.7 | 7.7 | 1.5 | -4.8 | 10.6 | 2.5 |
| Various industries | 0.8 | -4.2 | 0.1 | 4.5 | 2.5 | -4.1 | 0.8 | 4.6 |
| Production and distribution of electricity and gas | -2.6 | -12.3 | 6.7 | 3.8 | -8.5 | -1.5 | 9.7 | 5.2 |
| Water distribution and treatment of wastewater and waste | 1.5 | 2.7 | 6.0 | -4.8 | 3.8 | 0.8 | 2.6 | -2.5 |
| Construction | -0.7 | 2.0 | -0.5 | 1.0 | 3.2 | 2.2 | 5.8 | -3.5 |
| Trade, maintenance and repair | -0.5 | 7.4 | -1.3 | 3.9 | 0.6 | 4.5 | -0.7 | 2.3 |
| Transportation and warehousing services | -5.2 | 8.7 | 2.2 | 0.1 | -1.6 | 1.9 | 6.0 | -2.5 |
| Hotel, cafe and restaurant services | 0.6 | 2.8 | 8.4 | -0.4 | 2.1 | 7.0 | 9.2 | -0.8 |
| Information and communication | 4.3 | 2.5 | -0.7 | -0.2 | 4.7 | 0.6 | 0.6 | -0.2 |
| Financial activities | 5.0 | -2.2 | 3.3 | 1.1 | 0.1 | -10.9 | 5.0 | -3.5 |
| Public administration and defense services | 4.1 | -2.1 | 2.6 | -0.6 | 2.7 | -1.6 | 2.8 | 4.3 |
| Private and public education | 2.4 | -0.1 | 0.4 | 1.0 | 2.0 | 1.7 | 0.4 | 3.2 |
| Private and public health and social action | 3.9 | 3.4 | 0.5 | -0.8 | 3.8 | 2.4 | 0.4 | 0.6 |
| Other market services | 0.1 | 8.9 | 0.5 | 1.8 | 0.2 | 5.1 | 1.3 | 1.6 |
| Other household activities | 0.2 | 2.2 | 4.4 | 0.9 | 0.1 | 1.6 | 4.5 | 0.8 |
| Services provided by associative organizations | -0.4 | 5.1 | 3.3 | -0.1 | 0.2 | 2.7 | 3.7 | 0.2 |
| Market activities | 1.1 | 2.4 | 1.5 | 2.0 | 1.1 | 0.8 | 3.5 | 0.5 |
| Nonmarket activities | 3.0 | -1.5 | 2.3 | -0.6 | 2.1 | -0.3 | 2.4 | 3.9 |
| Total added value | 1.5 | 1.6 | 1.6 | 1.5 | 1.2 | 0.6 | 3.3 | 1.1 |
| Taxes net of subsidies on products | 2.1 | 24.3 | -7.0 | 1.7 | 4.4 | 15.6 | -8.1 | 1.2 |
| Gross domestic product | 1.5 | 2.6 | 1.2 | 1.5 | 1.4 | 1.3 | 2.6 | 1.1 |
jQuery("#tblEmployee-0").table2excel({ exclude: ".excludeThisClass", name: "Worksheet Name", filename: "SomeFile" });
Source : National Institute of StatisticsUpdate : 06-12-2025

| 2025-11-15 | Press release
The Real Gross Domestic Product GDP, seasonally adjusted, increased at an annual rate of 2,4% during the third quarter of the year 2025.
| 2025-09-12 | Report
This publication retraces the cyclical trends of a number of economic or social indicators.
| 2025-09-12 | Report
This publication retraces the cyclical trends of a number of economic or social indicators.
| 2025-09-12 | Report
This publication retraces the cyclical trends of a number of economic or social indicators.
| 2025-09-12 | Report
This publication retraces the cyclical trends of a number of economic or social indicators.
| 2025-09-12 | Report
This publication retraces the cyclical trends of a number of economic or social indicators.
| 2025-09-12 | Report
This publication retraces the cyclical trends of a number of economic or social indicators.

| 2025-08-15 | Press release
The Real Gross Domestic Product (GDP), seasonally adjusted, increased at an annual rate of 3.2% during the second quarter of the year 2025.

| 2025-05-15 | Press release
The Tunisian economy recorded a 1.6% growth during the first quarter of the year 2025.

| 2025-04-18 | Report
This is a reference work for those who need information about the economic and social life of the country.

| 2025-04-04 | Report
This booklet "Tunisia in Figures 2022" is designed as a publication for a simple and regular use.

| 2025-03-21 | Report
This publication retraces the cyclical trends of a number of economic or social indicators.

| 2025-03-19 | Report
This publication retraces the cyclical trends of a number of economic or social indicators.

| 2025-03-19 | Report
This publication retraces the cyclical trends of a number of economic or social indicators.

| 2025-03-19 | Report
This publication retraces the cyclical trends of a number of economic or social indicators.
| 2025-02-26 | Report
This publication retraces the cyclical trends of a number of economic or social indicators.
| 2025-02-26 | Report
This publication retraces the cyclical trends of a number of economic or social indicators.

| 2025-02-15 | Press release
The Tunisian economy recorded a 1.4% growth during the year 2024.
| 2024-12-30 | Report
This publication presents on a yearly basis the main accounts (basis 2015) of the national income accounting.
| 2024-11-20 | Report
This publication retraces the cyclical trends of a number of economic or social indicators.

| 2024-11-14 | Press release
The Real Gross Domestic Product GDP, seasonally adjusted, increased at an annual rate of 1.8% during the third quarter of the current year.
| 2024-09-23 | Report
This publication retraces the cyclical trends of a number of economic or social indicators.

| 2024-09-23 | Report
This publication retraces the cyclical trends of a number of economic or social indicators.

| 2024-09-23 | Report
This publication retraces the cyclical trends of a number of economic or social indicators.

| 2024-08-16 | Press release
Gross Domestic Product GDP, seasonally adjusted, increased at an annual rate of 1.0% during the second quarter of the current year.
| 2024-07-03 | Report
This publication retraces the cyclical trends of a number of economic or social indicators.
| 2024-07-03 | Report
This publication retraces the cyclical trends of a number of economic or social indicators.
| 2024-07-03 | Report
This publication retraces the cyclical trends of a number of economic or social indicators.

| 2024-05-15 | Press release
Real GDP increased at an annual rate of 0.2 percent in the first quarter of 2024.

| 2024-05-15 | Press release
Real GDP increased at an annual rate of 0.2 percent in the first quarter of 2024.

| 2024-03-25 | Report
This publication presents on a yearly basis the main accounts (basis 2015) of the national income accounting.

| 2024-03-20 | Report
Indebtedness of non-financial economic agents: Reading in the financial accounts

| 2024-03-14 | Report
This publication retraces the cyclical trends of a number of economic or social indicators.

| 2024-03-14 | Report
This publication retraces the cyclical trends of a number of economic or social indicators.
| 2024-03-14 | Report
This publication retraces the cyclical trends of a number of economic or social indicators.

| 2024-02-15 | Press release
In the fourth quarter of 2023, Real GDP decreased by -0.2%.

| 2023-12-21 | Report
This publication retraces the cyclical trends of a number of economic or social indicators.

| 2023-12-21 | Report
This publication retraces the cyclical trends of a number of economic or social indicators.

| 2023-11-18 | Report
This booklet "Tunisia in Figures 2021" is designed as a publication for a simple and regular use.

| 2023-11-18 | Report
This publication retraces the cyclical trends of a number of economic or social indicators.
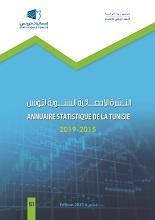
| 2023-11-17 | Report
This is a reference work for those who need information about the economic and social life of the country.

| 2023-11-16 | Report
This booklet "Tunisia in Figures 2020" is designed as a publication for a simple and regular use.

| 2023-11-15 | Press release
Real GDP decreased at an annual rate of 0.2 percent in the third quarter of 2023.

| 2023-10-04 | Report
This publication retraces the cyclical trends of a number of economic or social indicators.

| 2023-10-04 | Report
This publication retraces the cyclical trends of a number of economic or social indicators.

| 2023-10-04 | Report
This publication retraces the cyclical trends of a number of economic or social indicators.

| 2023-08-15 | Press release
Real GDP increased at an annual rate of 0.6 percent in the second quarter of 2023.

| 2023-06-08 | Report
This publication retraces the cyclical trends of a number of economic or social indicators.

| 2023-06-08 | Report
This publication retraces the cyclical trends of a number of economic or social indicators.

| 2023-06-08 | Report
This publication retraces the cyclical trends of a number of economic or social indicators.

| 2023-05-15 | Press release
Real GDP increased at an annual rate of 2.1 percent in the first quarter of 2023.
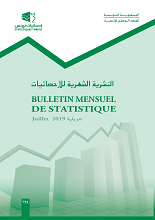
| 2023-03-27 | Report
This publication retraces the cyclical trends of a number of economic or social indicators.
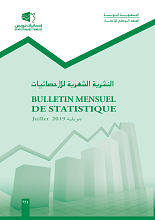
| 2023-03-24 | Report
This publication retraces the cyclical trends of a number of economic or social indicators.
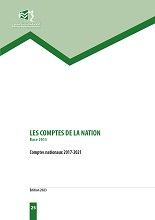
| 2023-03-22 | Report
This publication presents on a yearly basis the main accounts (basis 2015) of the national income accounting.
| 2023-03-08 | Report
This publication retraces the cyclical trends of a number of economic or social indicators.

| 2023-02-15 | Press release
Real GDP increased at an annual rate of 1.6 percent in the fourth quarter of 2022.
| 2022-12-09 | Report
This publication retraces the cyclical trends of a number of economic or social indicators.
| 2022-11-28 | Report
This publication retraces the cyclical trends of a number of economic or social indicators.
| 2022-11-28 | Report
This publication retraces the cyclical trends of a number of economic or social indicators.

| 2022-11-15 | Press release
Real GDP increased at an annual rate of 2.9 percent in the third quarter of 2022
| 2022-10-05 | Report
This is a reference work for those who need information about the economic and social life of the country.
| 2022-09-15 | Report
This publication retraces the cyclical trends of a number of economic or social indicators.
| 2022-09-14 | Report
This publication retraces the cyclical trends of a number of economic or social indicators.
| 2022-09-14 | Report
This publication presents on a yearly basis the main accounts (basis 2015) of the national income accounting.

| 2022-08-15 | Press release
Real GDP increased at an annual rate of 2.8 percent in the second quarter of 2022.

| 2022-08-15 | Press release
Real GDP increased at an annual rate of 2.8 percent in the second quarter of 2022.

| 2022-07-06 | Report
This publication retraces the cyclical trends of a number of economic or social indicators.

| 2022-06-24 | Report
This publication retraces the cyclical trends of a number of economic or social indicators.

| 2022-05-18 | Report
This publication retraces the cyclical trends of a number of economic or social indicators.

| 2022-05-16 | Press release
GDP posts a 2.4% growth in the first quarter of 2022.

| 2022-04-19 | Report
This publication retraces the cyclical trends of a number of economic or social indicators.
| 2022-04-04 | Report
This publication retraces the cyclical trends of a number of economic or social indicators.
| 2022-04-03 | Report
This publication retraces the cyclical trends of a number of economic or social indicators.

| 2022-03-15 | Press release
In the fourth quarter of 2021, the national economy grew at an annual rate of 1.6%. Over the whole of 2021, it shows growth of 3.1%.

| 2022-01-28 | Report
This publication retraces the cyclical trends of a number of economic or social indicators.

| 2021-12-03 | Report
This publication retraces the cyclical trends of a number of economic or social indicators.

| 2021-11-26 | Report
This publication retraces the cyclical trends of a number of economic or social indicators.

| 2021-11-15 | Press release
Tunisia's third quarter economic growth posted a 0.3% annual rate.

| 2021-10-22 | Report
This publication retraces the cyclical trends of a number of economic or social indicators.
| 2021-09-14 | Report
This publication retraces the cyclical trends of a number of economic or social indicators.

| 2021-09-14 | Report
This publication retraces the cyclical trends of a number of economic or social indicators.

| 2021-08-15 | Press release
GDP growth posted a rather “technical” correction of + 16.2% in the second quarter of 2021.

| 2021-08-15 | Press release
GDP growth posted a rather “technical” correction of + 16.2% in the second quarter of 2021.

| 2021-08-12 | Report
This publication retraces the cyclical trends of a number of economic or social indicators.
| 2021-07-29 | Report
This publication retraces the cyclical trends of a number of economic or social indicators.

| 2021-07-07 | Report
This booklet "Tunisia in Figures 2019" is designed as a publication for a simple and regular use.

| 2021-07-07 | Report
This is a reference work for those who need information about the economic and social life of the country.

| 2021-07-07 | Report
This is a reference work for those who need information about the economic and social life of the country.

| 2021-06-15 | Report
This publication retraces the cyclical trends of a number of economic or social indicators.

| 2021-05-28 | Report
This publication retraces the cyclical trends of a number of economic or social indicators.

| 2021-05-28 | Report
This publication retraces the cyclical trends of a number of economic or social indicators.

| 2021-04-22 | Report
This publication retraces the cyclical trends of a number of economic or social indicators.

| 2021-04-02 | Report
This publication retraces the cyclical trends of a number of economic or social indicators.

| 2021-02-24 | Report
This publication retraces the cyclical trends of a number of economic or social indicators.

| 2021-02-24 | Report
This publication retraces the cyclical trends of a number of economic or social indicators.

| 2021-01-13 | Report
This publication retraces the cyclical trends of a number of economic or social indicators.

| 2020-12-09 | Report
This publication retraces the cyclical trends of a number of economic or social indicators.
| 2020-11-27 | Report
This publication retraces the cyclical trends of a number of economic or social indicators.

| 2020-11-27 | Report
This publication retraces the cyclical trends of a number of economic or social indicators.
| 2020-10-22 | Report
This publication retraces the cyclical trends of a number of economic or social indicators.

| 2020-09-18 | Report
This is a reference work for those who need information about the economic and social life of the country.
| 2020-09-09 | Report
This publication retraces the cyclical trends of a number of economic or social indicators.
| 2020-09-01 | Report
This publication retraces the cyclical trends of a number of economic or social indicators.

| 2020-09-01 | Report
This publication retraces the cyclical trends of a number of economic or social indicators.

| 2020-09-01 | Report
This publication retraces the cyclical trends of a number of economic or social indicators.
| 2020-07-08 | Report
This publication retraces the cyclical trends of a number of economic or social indicators.

| 2020-06-16 | Report
This publication retraces the cyclical trends of a number of economic or social indicators.

| 2020-06-10 | Report
This publication retraces the cyclical trends of a number of economic or social indicators.

| 2020-06-09 | Report
This publication retraces the cyclical trends of a number of economic or social indicators.

| 2020-05-22 | Press release
In the first quarter of 2020, real GDP decreased by 1.7% compared to the same quarter of 2019 and by 2.0% compared to the fourth quarter of 2019.

| 2020-05-22 | Press release
In the first quarter of 2020, real GDP decreased by 1.7% compared to the same quarter of 2019 and by 2.0% compared to the fourth quarter of 2019.

| 2020-03-12 | Report
This publication retraces the cyclical trends of a number of economic or social indicators.

| 2020-02-19 | Report
This publication retraces the cyclical trends of a number of economic or social indicators.

| 2020-02-15 | Press release
In 2019, GDP increased by 1.0% after +2.7% in 2018.

| 2020-02-15 | Press release
In 2019, GDP increased by 1.0% after +2.7% in 2018.

| 2020-01-15 | Report
This publication retraces the cyclical trends of a number of economic or social indicators.
| 2019-12-13 | Report
This publication retraces the cyclical trends of a number of economic or social indicators.
| 2019-11-15 | Report
This publication retraces the cyclical trends of a number of economic or social indicators.

| 2019-11-15 | Press release
In the first nine months of 2019, GDP grew by 1.1%.
| 2019-10-08 | Report
This publication retraces the cyclical trends of a number of economic or social indicators.
| 2019-09-05 | Report
This publication retraces the cyclical trends of a number of economic or social indicators.
| 2019-09-05 | Report
This publication retraces the cyclical trends of a number of economic or social indicators.

| 2019-08-23 | Report
This publication presents on a yearly basis the main accounts (basis 1997) of the national income accounting.

| 2019-08-15 | Press release
In the second quarter of 2019, real GDP grew by 1.2% compared to the same quarter of 2018 and 0.5% compared to the first quarter of 2019. In the first half of 2019, GDP grew by 1.1%.

| 2019-07-31 | Report
This booklet "Tunisia in Figures 2018" is designed as a publication for a simple and regular use.
| 2019-07-29 | Report
This is a reference work for those who need information about the economic and social life of the country.
| 2019-07-15 | Report
This publication retraces the cyclical trends of a number of economic or social indicators.
| 2019-06-17 | Report
This publication retraces the cyclical trends of a number of economic or social indicators.
| 2019-05-15 | Report
This publication retraces the cyclical trends of a number of economic or social indicators.

| 2019-05-15 | Report
This publication retraces the cyclical trends of a number of economic or social indicators.
| 2019-04-16 | Report
This publication retraces the cyclical trends of a number of economic or social indicators.
| 2019-03-21 | Report
This publication retraces the cyclical trends of a number of economic or social indicators.
| 2019-02-18 | Report
This publication retraces the cyclical trends of a number of economic or social indicators.

| 2019-02-15 | Press release
In the fourth quarter of 2018, real GDP accelerated by 2.2% compared to the same quarter of 2017.
| 2019-01-28 | Report
This publication retraces the cyclical trends of a number of economic or social indicators.

| 2018-12-17 | Report
This publication retraces the cyclical trends of a number of economic or social indicators.
| 2018-11-21 | Report
This publication retraces the cyclical trends of a number of economic or social indicators.

| 2018-11-21 | Report
This publication retraces the cyclical trends of a number of economic or social indicators.

| 2018-11-21 | Report
This publication retraces the cyclical trends of a number of economic or social indicators.
| 2018-10-11 | Report
This publication retraces the cyclical trends of a number of economic or social indicators.
| 2018-10-03 | Report
This publication retraces the cyclical trends of a number of economic or social indicators.
| 2018-08-23 | Report
This publication retraces the cyclical trends of a number of economic or social indicators.

| 2018-08-23 | Report
This publication retraces the cyclical trends of a number of economic or social indicators.
| 2018-08-07 | Report
This publication retraces the cyclical trends of a number of economic or social indicators.

| 2018-08-06 | Report
This publication presents on a yearly basis the main accounts (basis 1997) of the national income accounting.
| 2018-07-31 | Report
This publication retraces the cyclical trends of a number of economic or social indicators.

| 2018-07-31 | Report
This publication retraces the cyclical trends of a number of economic or social indicators.
| 2018-05-29 | Report
This publication retraces the cyclical trends of a number of economic or social indicators.
| 2018-05-24 | Report
This is a reference work for those who need information about the economic and social life of the country.

| 2018-05-24 | Report
This is a reference work for those who need information about the economic and social life of the country.

| 2018-05-24 | Report
This is a reference work for those who need information about the economic and social life of the country.
| 2018-05-04 | Report
This publication retraces the cyclical trends of a number of economic or social indicators.

| 2018-05-04 | Report
This publication retraces the cyclical trends of a number of economic or social indicators.
| 2018-04-01 | Report
This publication retraces the cyclical trends of a number of economic or social indicators.
| 2018-03-27 | Report
This publication retraces the cyclical trends of a number of economic or social indicators.

| 2018-03-27 | Report
This publication retraces the cyclical trends of a number of economic or social indicators.

| 2018-03-27 | Report
This publication retraces the cyclical trends of a number of economic or social indicators.

| 2018-03-27 | Report
This publication retraces the cyclical trends of a number of economic or social indicators.
| 2018-01-25 | Report
This publication retraces the cyclical trends of a number of economic or social indicators.
| 2018-01-25 | Report
This publication retraces the cyclical trends of a number of economic or social indicators.

| 2018-01-25 | Report
This publication retraces the cyclical trends of a number of economic or social indicators.

| 2018-01-25 | Report
This publication retraces the cyclical trends of a number of economic or social indicators.
| 2017-12-14 | Report
This publication retraces the cyclical trends of a number of economic or social indicators.

| 2017-11-15 | Press release
The gross domestic product (GDP) grew by 2.1% compared to the quarter of 2016 and by 0.7% compared to the previous quarter.

| 2017-11-15 | Press release
The gross domestic product (GDP) grew by 2.1% compared to the quarter of 2016 and by 0.7% compared to the previous quarter.
| 2017-11-10 | Report
This publication retraces the cyclical trends of a number of economic or social indicators.

| 2017-11-10 | Report
This publication retraces the cyclical trends of a number of economic or social indicators.
| 2017-10-12 | Report
This publication retraces the cyclical trends of a number of economic or social indicators.

| 2017-10-12 | Report
This publication retraces the cyclical trends of a number of economic or social indicators.
| 2017-08-28 | Report
This publication retraces the cyclical trends of a number of economic or social indicators.
| 2017-08-28 | Report
This publication retraces the cyclical trends of a number of economic or social indicators.

| 2017-08-28 | Report
This publication retraces the cyclical trends of a number of economic or social indicators.
| 2017-06-15 | Report
This publication retraces the cyclical trends of a number of economic or social indicators.
| 2017-05-16 | Report
This publication retraces the cyclical trends of a number of economic or social indicators.

| 2017-05-16 | Report
This publication retraces the cyclical trends of a number of economic or social indicators.

| 2017-05-12 | Brochure
INS publishes every year a leaflet edited in three languages (Arabic, French, English) retracing the main economic and social indicators of Tunisia.
| 2017-05-12 | Report
This is a reference work for those who need information about the economic and social life of the country.

| 2017-05-12 | Report
This booklet "Tunisia in Figures 2016" is designed as a publication for a simple and regular use.
| 2017-05-10 | Report
This publication retraces the cyclical trends of a number of economic or social indicators.

| 2017-04-21 | Report
This publication presents on a yearly basis the main accounts (basis 1997) of the national income accounting.
| 2017-03-16 | Report
This publication retraces the cyclical trends of a number of economic or social indicators.
| 2017-02-20 | Report
This publication retraces the cyclical trends of a number of economic or social indicators.
| 2017-02-01 | Report
This publication retraces the cyclical trends of a number of economic or social indicators.
| 2016-12-22 | Report
This publication retraces the cyclical trends of a number of economic or social indicators.
| 2016-11-18 | Report
This publication retraces the cyclical trends of a number of economic or social indicators.
| 2016-10-19 | Report
This publication retraces the cyclical trends of a number of economic or social indicators.
| 2016-10-19 | Report
This publication retraces the cyclical trends of a number of economic or social indicators.
| 2016-08-22 | Report
This publication retraces the cyclical trends of a number of economic or social indicators.
| 2016-08-03 | Report
This publication retraces the cyclical trends of a number of economic or social indicators.
| 2016-06-15 | Report
This publication retraces the cyclical trends of a number of economic or social indicators.
| 2016-05-23 | Report
This publication retraces the cyclical trends of a number of economic or social indicators.

| 2016-04-29 | Brochure
INS publishes every year a leaflet edited in three languages (Arabic, French, English) retracing the main economic and social indicators of Tunisia.
| 2016-04-15 | Report
This publication retraces the cyclical trends of a number of economic or social indicators.
| 2016-04-06 | Report
This publication retraces the cyclical trends of a number of economic or social indicators.
| 2016-03-28 | Report
This is a reference work for those who need information about the economic and social life of the country.

| 2016-03-21 | Report
This publication presents on a yearly basis the main accounts (basis 1997) of the national income accounting.

| 2016-03-08 | Report
This booklet "Tunisia in Figures 2013-2014" is designed as a publication for a simple and regular use.
| 2016-02-10 | Report
This publication retraces the cyclical trends of a number of economic or social indicators.
| 2015-12-09 | Report
This publication retraces the cyclical trends of a number of economic or social indicators.
| 2015-12-09 | Report
This publication retraces the cyclical trends of a number of economic or social indicators.
| 2015-10-08 | Report
This publication retraces the cyclical trends of a number of economic or social indicators.
| 2015-09-25 | Report
This publication retraces the cyclical trends of a number of economic or social indicators.
| 2015-09-15 | Report
This publication retraces the cyclical trends of a number of economic or social indicators.
| 2015-08-19 | Report
This publication retraces the cyclical trends of a number of economic or social indicators.
| 2015-07-23 | Report
This publication retraces the cyclical trends of a number of economic or social indicators.
| 2015-07-10 | Report
This publication retraces the cyclical trends of a number of economic or social indicators.
| 2015-05-26 | Report
This publication retraces the cyclical trends of a number of economic or social indicators.
| 2015-05-26 | Report
This publication retraces the cyclical trends of a number of economic or social indicators.
| 2015-05-26 | Report
This publication retraces the cyclical trends of a number of economic or social indicators.
| 2015-01-02 | Report
This publication retraces the cyclical trends of a number of economic or social indicators.
| 2014-12-19 | Report
This publication retraces the cyclical trends of a number of economic or social indicators.
| 2014-11-22 | Report
This publication retraces the cyclical trends of a number of economic or social indicators.

| 2014-11-11 | Report
This booklet "Tunisia in Figures 2012" is designed as a publication for a simple and regular use.
| 2014-10-30 | Report
This publication retraces the cyclical trends of a number of economic or social indicators.
| 2014-09-30 | Report
This publication retraces the cyclical trends of a number of economic or social indicators.
| 2014-08-30 | Report
This publication retraces the cyclical trends of a number of economic or social indicators.
| 2014-07-30 | Report
This publication retraces the cyclical trends of a number of economic or social indicators.
| 2014-06-30 | Report
This publication retraces the cyclical trends of a number of economic or social indicators.
| 2014-05-30 | Report
This publication retraces the cyclical trends of a number of economic or social indicators.
| 2014-04-30 | Report
This publication retraces the cyclical trends of a number of economic or social indicators.

| 2014-04-21 | Report
This publication presents on a yearly basis the main accounts (basis 1997) of the national income accounting.
| 2014-03-30 | Report
This publication retraces the cyclical trends of a number of economic or social indicators.
| 2014-02-28 | Report
This publication retraces the cyclical trends of a number of economic or social indicators.

| 2014-01-30 | Report
This publication presents on a yearly basis the main accounts (basis 1997) of the national income accounting.
| 2014-01-16 | Report
This publication retraces the cyclical trends of a number of economic or social indicators.

| 2014-01-16 | Report
This publication retraces the cyclical trends of a number of economic or social indicators.
| 2013-12-16 | Report
This publication retraces the cyclical trends of a number of economic or social indicators.
| 2013-11-25 | Report
This publication retraces the cyclical trends of a number of economic or social indicators.
| 2013-10-24 | Report
This is a reference work for those who need information about the economic and social life of the country.
| 2013-10-11 | Report
This publication retraces the cyclical trends of a number of economic or social indicators.
| 2013-09-30 | Report
This publication retraces the cyclical trends of a number of economic or social indicators.

| 2013-08-30 | Report
This publication retraces the cyclical trends of a number of economic or social indicators.

| 2013-07-30 | Report
This publication retraces the cyclical trends of a number of economic or social indicators.

| 2013-06-27 | Report
This publication retraces the cyclical trends of a number of economic or social indicators.

| 2013-05-30 | Report
This publication retraces the cyclical trends of a number of economic or social indicators.

| 2013-04-30 | Report
This publication retraces the cyclical trends of a number of economic or social indicators.

| 2013-03-30 | Report
This publication retraces the cyclical trends of a number of economic or social indicators.

| 2013-02-28 | Report
This publication retraces the cyclical trends of a number of economic or social indicators.

| 2013-01-21 | Report
This publication retraces the cyclical trends of a number of economic or social indicators.

| 2012-12-30 | Brochure
INS publishes every year a leaflet edited in three languages (Arabic, French, English) retracing the main economic and social indicators of Tunisia.

| 2012-12-30 | Report
This publication presents on a yearly basis the main accounts (basis 1997) of the national income accounting.

| 2012-12-30 | Report
This booklet "Tunisia in Figures 2009-2011" is designed as a publication for a simple and regular use.

| 2012-12-30 | Report
This publication retraces the cyclical trends of a number of economic or social indicators.

| 2012-11-14 | Report
This publication retraces the cyclical trends of a number of economic or social indicators.

| 2012-10-12 | Report
This publication retraces the cyclical trends of a number of economic or social indicators.

| 2012-09-30 | Report
This publication retraces the cyclical trends of a number of economic or social indicators.
| 2012-08-11 | Report
This is a reference work for those who need information about the economic and social life of the country.

| 2012-08-11 | Report
This publication retraces the cyclical trends of a number of economic or social indicators.

| 2012-07-12 | Report
This publication retraces the cyclical trends of a number of economic or social indicators.

| 2012-06-15 | Report
This publication retraces the cyclical trends of a number of economic or social indicators.

| 2012-05-12 | Report
This publication retraces the cyclical trends of a number of economic or social indicators.

| 2012-04-18 | Report
This publication retraces the cyclical trends of a number of economic or social indicators.

| 2012-03-17 | Report
This publication retraces the cyclical trends of a number of economic or social indicators.

| 2012-02-17 | Report
This publication retraces the cyclical trends of a number of economic or social indicators.
| 2012-01-30 | Report
This publication retraces the cyclical trends of a number of economic or social indicators.

| 2011-12-30 | Brochure
INS publishes every year a leaflet edited in three languages (Arabic, French, English) retracing the main economic and social indicators of Tunisia.
| 2011-12-30 | Report
This booklet "Tunisia in Figures 2008-2010" is designed as a publication for a simple and regular use.
| 2011-12-12 | Report
This publication retraces the cyclical trends of a number of economic or social indicators.
| 2011-11-23 | Report
This publication retraces the cyclical trends of a number of economic or social indicators.

| 2011-11-12 | Report
This is a reference work for those who need information about the economic and social life of the country.
| 2011-10-08 | Report
This publication retraces the cyclical trends of a number of economic or social indicators.
| 2011-09-30 | Report
This publication retraces the cyclical trends of a number of economic or social indicators.
| 2011-08-16 | Report
This publication retraces the cyclical trends of a number of economic or social indicators.
| 2011-07-17 | Report
This publication retraces the cyclical trends of a number of economic or social indicators.

| 2011-06-12 | Report
This publication presents on a yearly basis the main accounts (basis 1997) of the national income accounting.
| 2011-06-11 | Report
This publication retraces the cyclical trends of a number of economic or social indicators.
| 2011-05-30 | Report
This publication retraces the cyclical trends of a number of economic or social indicators.
| 2011-04-11 | Report
This publication retraces the cyclical trends of a number of economic or social indicators.
| 2011-03-14 | Report
This publication retraces the cyclical trends of a number of economic or social indicators.
| 2011-02-21 | Report
This publication retraces the cyclical trends of a number of economic or social indicators.
| 2011-01-11 | Report
This publication retraces the cyclical trends of a number of economic or social indicators.
| 2010-12-16 | Report
This publication retraces the cyclical trends of a number of economic or social indicators.

| 2010-12-16 | Report
This publication presents on a yearly basis the main accounts (basis 1997) of the national income accounting.
| 2010-11-12 | Report
This publication retraces the cyclical trends of a number of economic or social indicators.
| 2010-10-14 | Report
This publication retraces the cyclical trends of a number of economic or social indicators.
| 2010-09-16 | Report
This publication retraces the cyclical trends of a number of economic or social indicators.
| 2010-08-14 | Report
This publication retraces the cyclical trends of a number of economic or social indicators.
| 2010-07-05 | Report
This publication retraces the cyclical trends of a number of economic or social indicators.
| 2010-06-10 | Report
This publication retraces the cyclical trends of a number of economic or social indicators.
| 2010-05-12 | Report
This publication retraces the cyclical trends of a number of economic or social indicators.
| 2010-04-11 | Report
This publication retraces the cyclical trends of a number of economic or social indicators.

| 2010-03-26 | Report
This is a reference work for those who need information about the economic and social life of the country.
| 2010-03-11 | Report
This publication retraces the cyclical trends of a number of economic or social indicators.
| 2010-02-14 | Report
This publication retraces the cyclical trends of a number of economic or social indicators.
| 2010-01-27 | Report
This booklet "Tunisia in Figures 2007-2009" is designed as a publication for a simple and regular use.
| 2010-01-11 | Report
This publication retraces the cyclical trends of a number of economic or social indicators.
| 2009-12-30 | Report
This booklet "Tunisia in Figures 2008" is designed as a publication for a simple and regular use.
| 2009-12-13 | Report
This publication retraces the cyclical trends of a number of economic or social indicators.
| 2009-11-14 | Report
This publication retraces the cyclical trends of a number of economic or social indicators.
| 2009-10-20 | Report
This publication retraces the cyclical trends of a number of economic or social indicators.
| 2009-09-15 | Report
This publication retraces the cyclical trends of a number of economic or social indicators.
| 2009-08-13 | Report
This publication retraces the cyclical trends of a number of economic or social indicators.
| 2009-07-21 | Report
This publication retraces the cyclical trends of a number of economic or social indicators.

| 2009-07-21 | Report
This publication presents on a yearly basis the main accounts (basis 1983) of the national income accounting.
| 2009-06-18 | Report
This publication retraces the cyclical trends of a number of economic or social indicators.

| 2009-06-13 | Report
This is a reference work for those who need information about the economic and social life of the country.
| 2009-05-30 | Report
This publication retraces the cyclical trends of a number of economic or social indicators.
| 2009-04-15 | Report
This publication retraces the cyclical trends of a number of economic or social indicators.
| 2009-03-15 | Report
This publication retraces the cyclical trends of a number of economic or social indicators.
| 2009-02-28 | Report
This publication retraces the cyclical trends of a number of economic or social indicators.
| 2009-01-16 | Report
This publication retraces the cyclical trends of a number of economic or social indicators.
| 2008-12-30 | Report
This booklet "Tunisia in Figures 2007" is designed as a publication for a simple and regular use.
| 2008-12-14 | Report
This publication retraces the cyclical trends of a number of economic or social indicators.

| 2008-09-21 | Report
This is a reference work for those who need information about the economic and social life of the country.

| 2008-04-15 | Report
This publication presents on a yearly basis the main accounts (basis 1983) of the national income accounting.
| 2007-12-30 | Report
This booklet "Tunisia in Figures 2006" is designed as a publication for a simple and regular use.

| 2007-12-14 | Report
This publication presents on a yearly basis the main accounts (basis 1983) of the national income accounting.

| 2007-08-15 | Report
This is a reference work for those who need information about the economic and social life of the country.
| 2006-12-30 | Report
This booklet "Tunisia in Figures 2005" is designed as a publication for a simple and regular use.

| 2006-05-16 | Report
This is a reference work for those who need information about the economic and social life of the country.

| 2006-02-28 | Report
This publication presents on a yearly basis the main accounts (basis 1983) of the national income accounting.
| 2005-12-30 | Report
This booklet "Tunisia in Figures 2004" is designed as a publication for a simple and regular use.

| 2005-09-22 | Report
This is a reference work for those who need information about the economic and social life of the country.

| 2004-10-15 | Report
This is a reference work for those who need information about the economic and social life of the country.

| 2003-07-15 | Report
This is a reference work for those who need information about the economic and social life of the country.

| 2002-09-14 | Report
This is a reference work for those who need information about the economic and social life of the country.
«
»
2004-02-10 | Foreign Trade
Data dissemination standards (SDDS).
2004-02-10 | Foreign Trade
Data dissemination standards (SDDS).

